Plotly PDF Report
Introduction
Plotly is a scientific graphing library for Python which can create both interactive and static graphs. These graphs can be displayed using Plotly’s online platform or created locally. During one of my projects I wanted a way to combine multiple figures into a PDF report; this is how I achieved it using xhtml2pdf Python module.
Example figures
To demonstrate creating a report we will use some example figures:
import plotly.express as px
fig_scatter = px.scatter(x=[1,2,3,4,5],
y=[5,4,3,2,1],
width=900,
title="Example Scatter Plot")
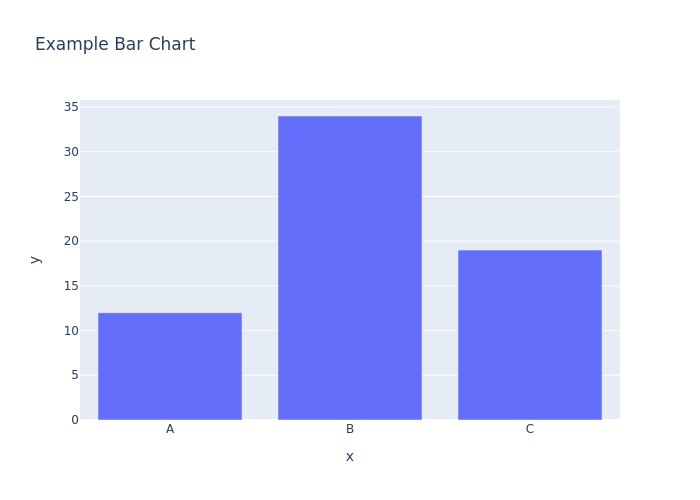
fig_bar = px.bar(x=["A","B","C"],
y=[12, 34, 19],
width=900,
title="Example Bar Chart")
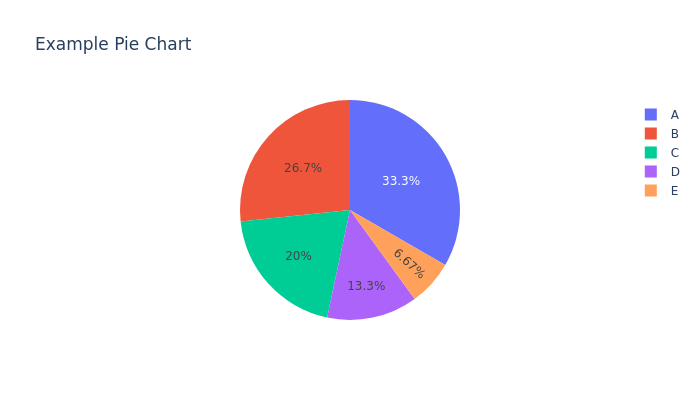
fig_pie = px.pie(values=[5,4,3,2,1],
names=["A","B","C","D","E"],
width=900,
title='Example pie chart')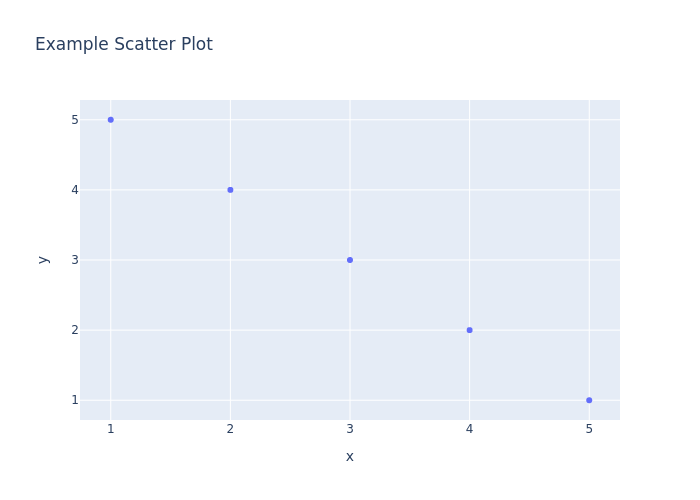
The width property needs to be set to avoid the plot being too large for the html content frame causing a LayoutError.
Generating images on the fly
The images can be imported into the PDF by xhtml2pdf using the HTML <img> tag. Plotly provides a write_image function that can export a static image of a figure in a variety of formats, e.g. png, svg, jpeg. To avoid having to export an image then reimport it to the PDF the figure can also be exported to a byte object. This can be kept in the memory, converted to base64 and written directly to the <img> tag.
import base64


def figure_to_base64(figures):
    for figure in figures:
        image = str(base64.b64encode(figure.to_image(format="png", scale=2)))[2:-1]
        images_html += (f'<img src="data:image/png;base64,{image}"><br>')

    return images_html


figures = [fig_scatter,
           fig_bar,
           fig_pie]

images_html = figure_to_base64(figures)
Generating the HTML report
xhtml2pdf uses static frames to define content that remains the same across pdf pages and content frames to position the to be converted HTML content. The documentation provides an example HTML layout for a PDF with 2 static frames and 1 content frame. This can be used as template to add the generated <img> tags to.
Template HTML
template.html
<html> <head> <style> @page { size: a4 portrait; @frame header_frame { /* Static Frame */ -pdf-frame-content: header_content; left: 50pt; width: 512pt; top: 50pt; height: 40pt; } @frame content_frame { /* Content Frame */ left: 50pt; width: 512pt; top: 90pt; height: 632pt; } @frame footer_frame { /* Another static Frame */ -pdf-frame-content: footer_content; left: 50pt; width: 512pt; top: 772pt; height: 20pt; } } </style> </head> <body> <!-- Content for Static Frame 'header_frame' --> <div id="header_content"><p style="font-size: 24px;">Example plotly report</p></div> <!-- Content for Static Frame 'footer_frame' --> <div id="footer_content">Page <pdf:pagenumber> of <pdf:pagecount> </div> <!-- HTML Content --> {{ FIGURES }} </body> </html>
Creating the HTML report from the template
The <img> tags can then be inserted into template.html creating the HTML to be converted into the PDF.
def create_html_report(template_file, images_html):
    with open(template_file, 'r') as f:
        template_html = f.read()

    report_html = template_html.replace("{{ FIGURES }}", images_html)

    return report_html


report_html = create_html_report("template.html", images_html)
Converting HTML to PDF
We can then take the generated HTML report and convert it to a PDF using xhtml2pdf.
from xhtml2pdf import pisa


def convert_html_to_pdf(source_html, output_filename):
    with open(f"{output_filename}", "w+b") as f:
        pisa_status = pisa.CreatePDF(source_html, dest=f)

    return pisa_status.err


convert_html_to_pdf(report_html, "report")
Complete script
The complete Python script to generate the PDF report is below.
import base64
import plotly.express as px
from xhtml2pdf import pisa


def figure_to_base64(figures):
    images_html = ""
    for figure in figures:
        image = str(base64.b64encode(figure.to_image(format="png", scale=2)))[2:-1]
        images_html += (f'<img src="data:image/png;base64,{image}"><br>')
    return images_html

def create_html_report(template_file, images_html):
    with open(template_file,'r') as f:
        template_html = f.read()
    report_html = template_html.replace("{{ FIGURES }}", images_html)
    return report_html

def convert_html_to_pdf(source_html, output_filename):
    with open(f"{output_filename}", "w+b") as f:
        pisa_status = pisa.CreatePDF(source_html, dest=f)
    return pisa_status.err


fig_scatter = px.scatter(x=[1,2,3,4,5],
                         y=[5,4,3,2,1],
                         width=900.
                         title="Example Scatter Plot")

fig_bar = px.bar(x=["A","B","C"],
                 y=[12, 34, 19],
                 width=900.
                 title="Example Bar Chart")

fig_pie = px.pie(values=[5,4,3,2,1],
                 names=["A","B","C","D","E"],
                 width=900.
                 title='Example pie chart')

figures = [fig_scatter,
           fig_bar,
           fig_pie]

images_html = figure_to_base64(figures)
report_html = create_html_report("template.html", images_html)
convert_html_to_pdf(report_html, "report.pdf")
The generated file can be found here: report.pdf
Conclusion
This article shows the basis of generating a PDF report with Plotly figures using xhtml2pdf. By altering the HTML template more complex reports can be generated.
